

Discover V-Ray Profiler and learn how it can help optimize rendering performance and become an essential tool in your projects.
V-Ray Profiler is a powerful tool that equips artists of all levels with the means to identify areas for optimizing rendering performance. With the release of V-Ray 6, update 1 for Maya, and Cinema 4D, our renderer has become even more powerful with new features that provide even more insight. Let’s explore the V-Ray Profiler’s development journey, how it works, and how it can be an indispensable tool in projects of any size.
What is V-Ray Profiler?
V-Ray Profiler helps users determine how long different components of their scenes took to render. It can be used for diagnosing and comparing the performance of different materials, meshes with subdivision and displacement, render settings, and different workflows and approaches.
The Profiler reports are split into two sections — System and Render. The System part of the report focuses on different pre-render and post-render tasks. The Render part details the time spent sampling shaders and volumes during rendering. The segments are then broken down into more detailed types of contributions of each shader or volume, such as GI, direct light, reflections, refractions, etc.
It all started with a ray of hope and a trace of light
Something that we’re proud of at Chaos is our relationships with our users. We always try to stay on top of forum messages and emails, and it's not uncommon for us to arrange meetings to discuss challenges our customers face while working on their projects.
A recurring topic is whether scenes can be optimized for performance. We would usually work with clients to investigate specific cases, run them through code profiling tools, and make recommendations on changing shader trees, geometry, render settings, or anything else that’s relevant.
Unfortunately, the process can occasionally become time-consuming, and the most natural question occurred soon enough: Could we empower our users to diagnose these issues themselves? We already had some tools like the memory tracker and a detailed log, but there was obviously a need for something more.
As a solution, we devised the V-Ray Profiler. Its purpose is to report how much time was spent on each material and on its shading components (GI, reflection, refraction, etc). The metrics would be recorded in reports that could be read offline in text format or displayed in online tracing tools like Google Chrome's Tracer.
It made its debut in V-Ray 6 for Maya, but we knew there was room to develop it even further. The next V-Ray 6 for Maya, hotfix 1 release added the ability to record metrics for even more ray bounces. This allowed users to profile more complicated setups, for example, shots where the camera is behind a window or looking at a mirror.
The shading reports are enlightening, but there are other important aspects of rendering a scene. There are many factors that can contribute to slowdowns — unnecessarily heavy geometry, very detailed displacement, and slower light cache compilation due to settings, to name a few. To help with that V-Ray 6, update 1 added the Profiler’s System mode - it gives you information for the time spent compiling geometry per object, light cache building, export, plugin initialization, and many more. With this addition, V-Ray Profiler became an irreplaceable tool for us internally and hopefully for many of our clients.
The V-Ray Profiler came to Houdini with their official version 6 release, and then after for Cinema 4D with V-Ray 6, update 1, but we plan to keep adding it to more of our integrations so all of our users can benefit. If your favorite platform is not yet on the list, don’t fret, as the profiler is also available for V-Ray App SDK and also for our Standalone version, where with a few arguments in the command line, it can be enabled for any .vrscene.
System mode: Pre & post-rendering breakdown
This mode reports time spent on processes that occur before and after rendering (there is also a section of it that is dedicated to the actual time spent rendering, but it’s not further broken down in this mode. Details on time spent in shading are found in the Render breakdown).
The main events are listed in chronological order, and the report resembles a timeline. The processes can include but are not limited to geometry compilation, keyframe creation, light cache building, plugin initialization, and others.
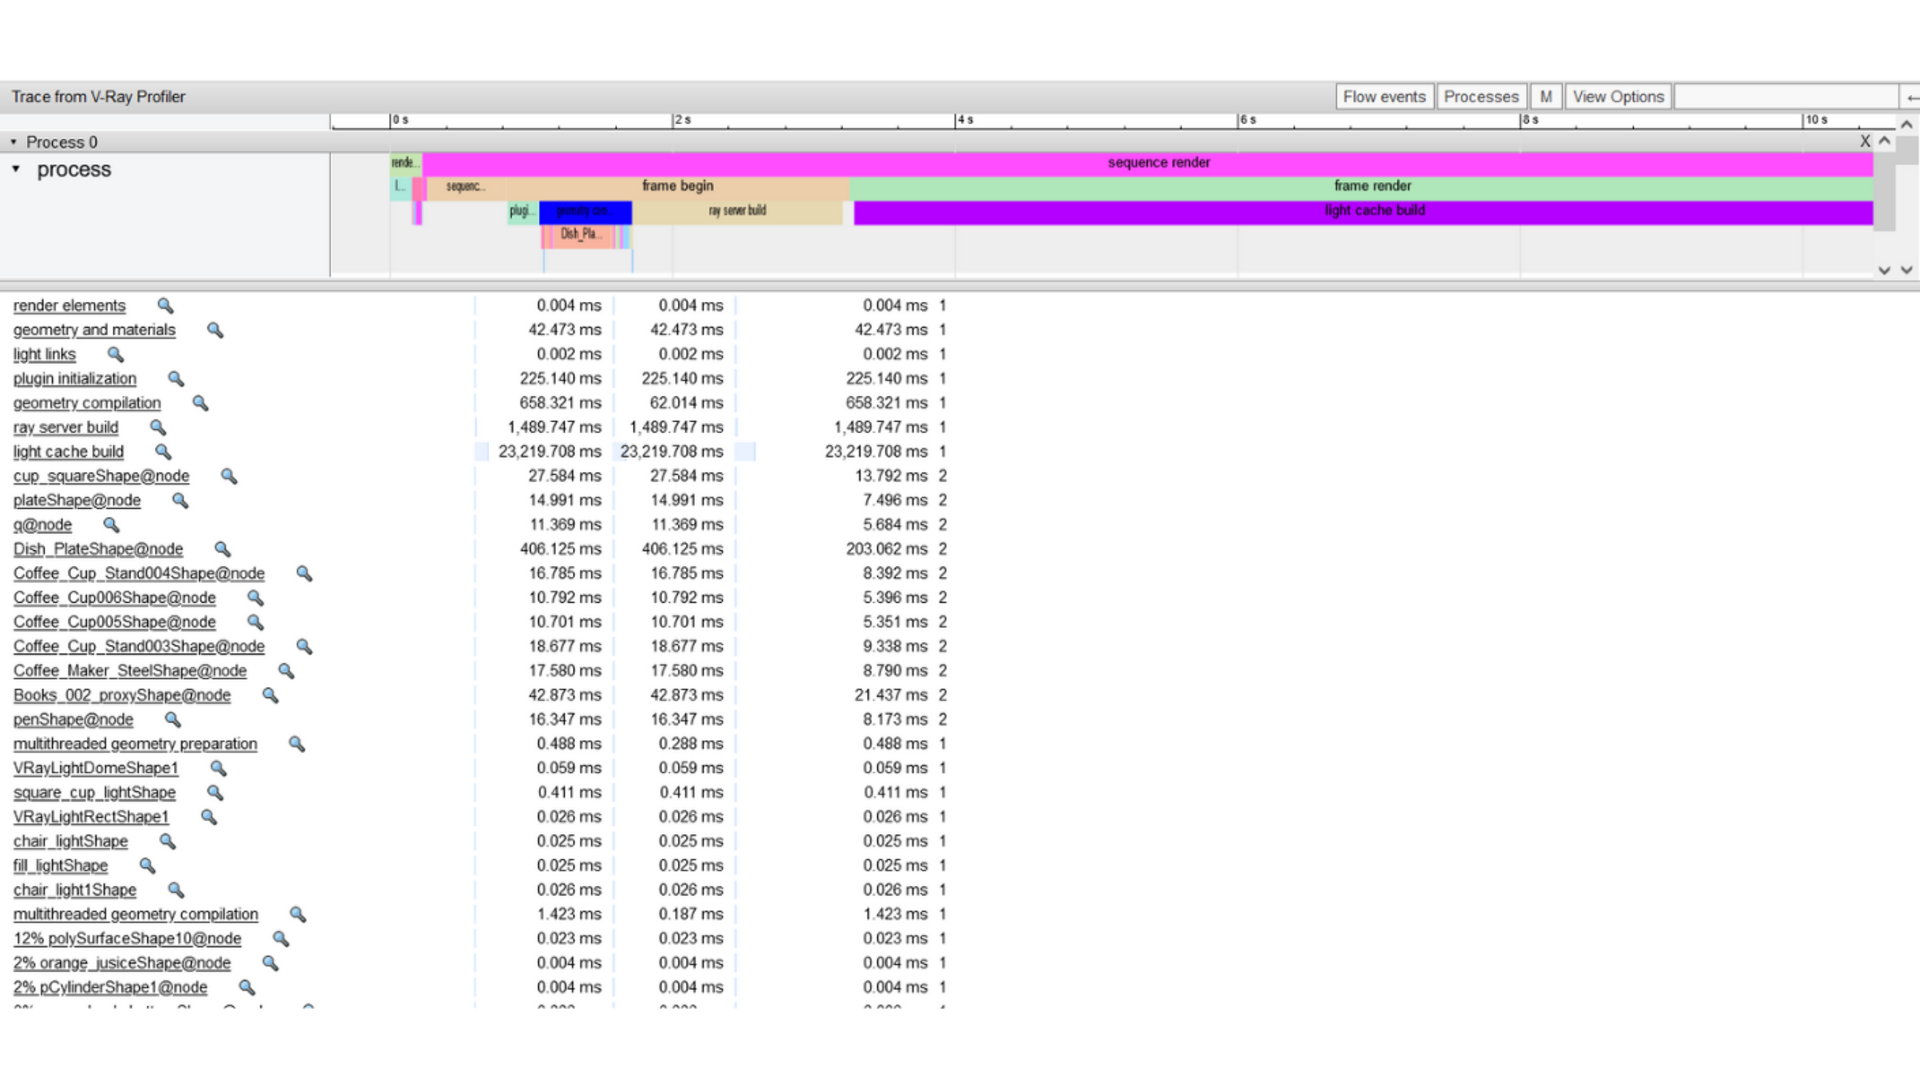
V-Ray has internally tracked many of these processes for a while as they can be used to calculate things such as Render time estimates and because there’s virtually no performance cost.
The System Profiler expands on these preexisting practices by giving more detailed breakdowns — e.g., not just the time spent compiling all of the geometry but a breakdown for each asset, and by the same principle, the initializing of every plugin, every light, and so on.
If you have doubts that the first pixels are taking a suspicious amount of time to arrive in the VFB, then this is the mode you should be looking at. It is available on its own in System mode, but it is also always included in the All mode alongside the Render breakdown.
Render mode: shading process breakdown
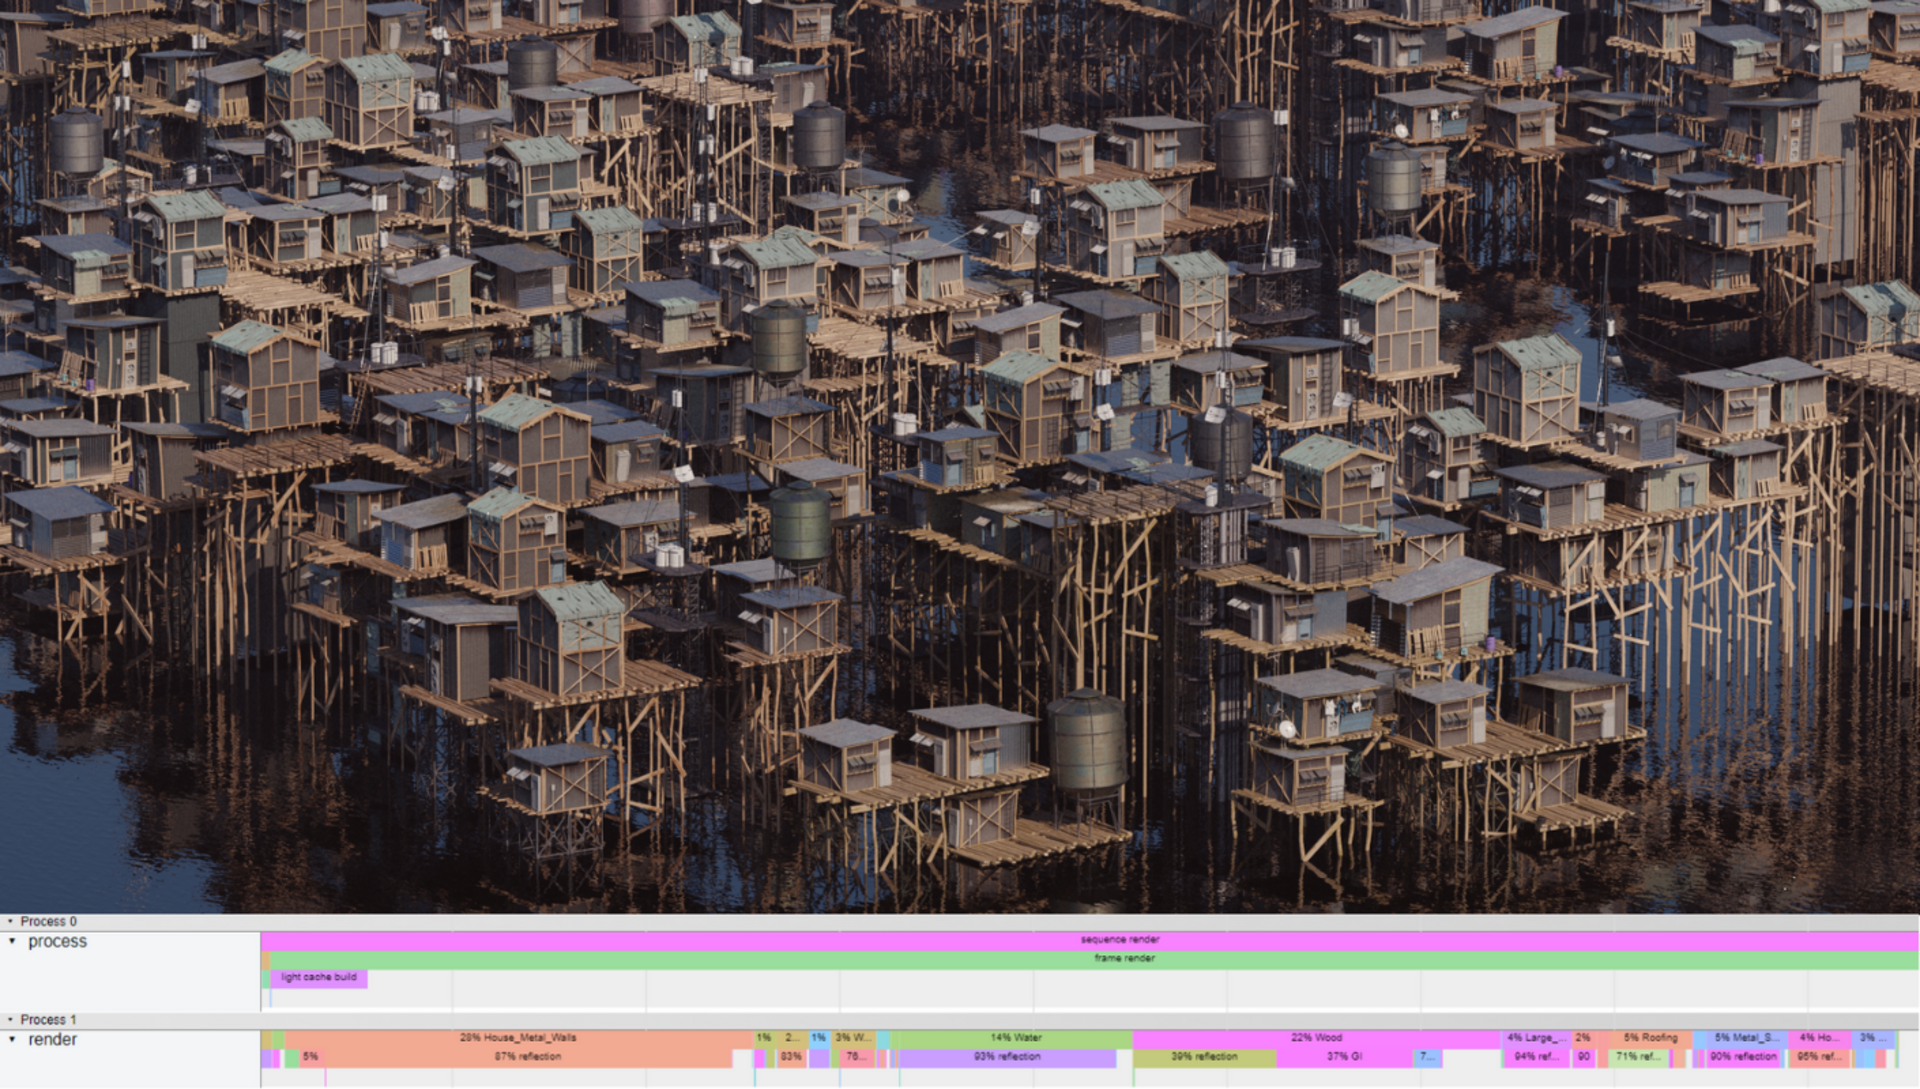
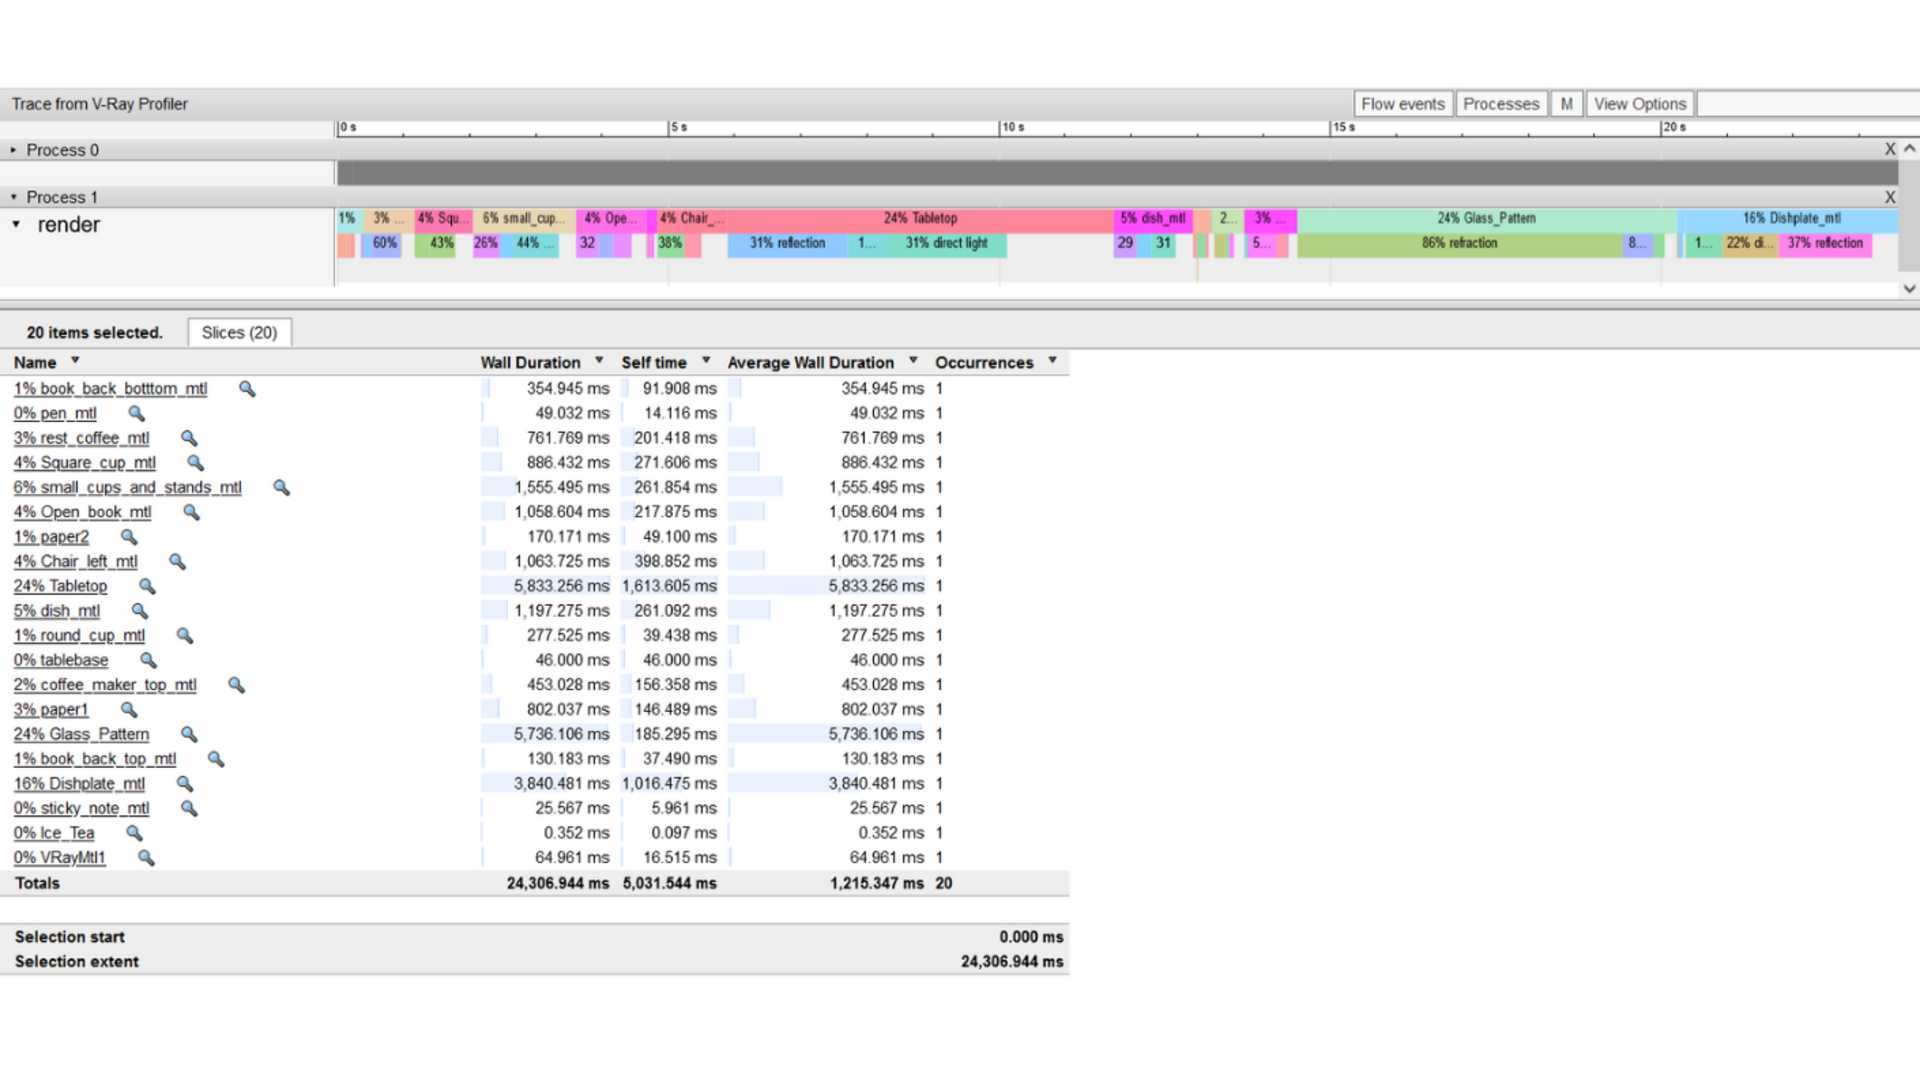
The rendering report gives a detailed breakdown of what events took place during the shading process of materials and volumes. The computation of a material’s contribution is then broken down into its components — direct light, GI, reflection, refraction, time used for each texture, and others.
The profile will show only the components V-Ray has calculated — e.g., if a material doesn't have any refraction enabled, it will not have a refraction component (as it would have taken 0 seconds, and there is no way to represent that visually).
Trace to the finish
One of the key things to remember when using the V-Ray Profiler is max depth. While it might be interesting to see reports in their full depth, it’s something to be used with caution as it can cause a performance hit. To understand why this happens, we’d need to go into the specifics of how it records the duration of all of its events.
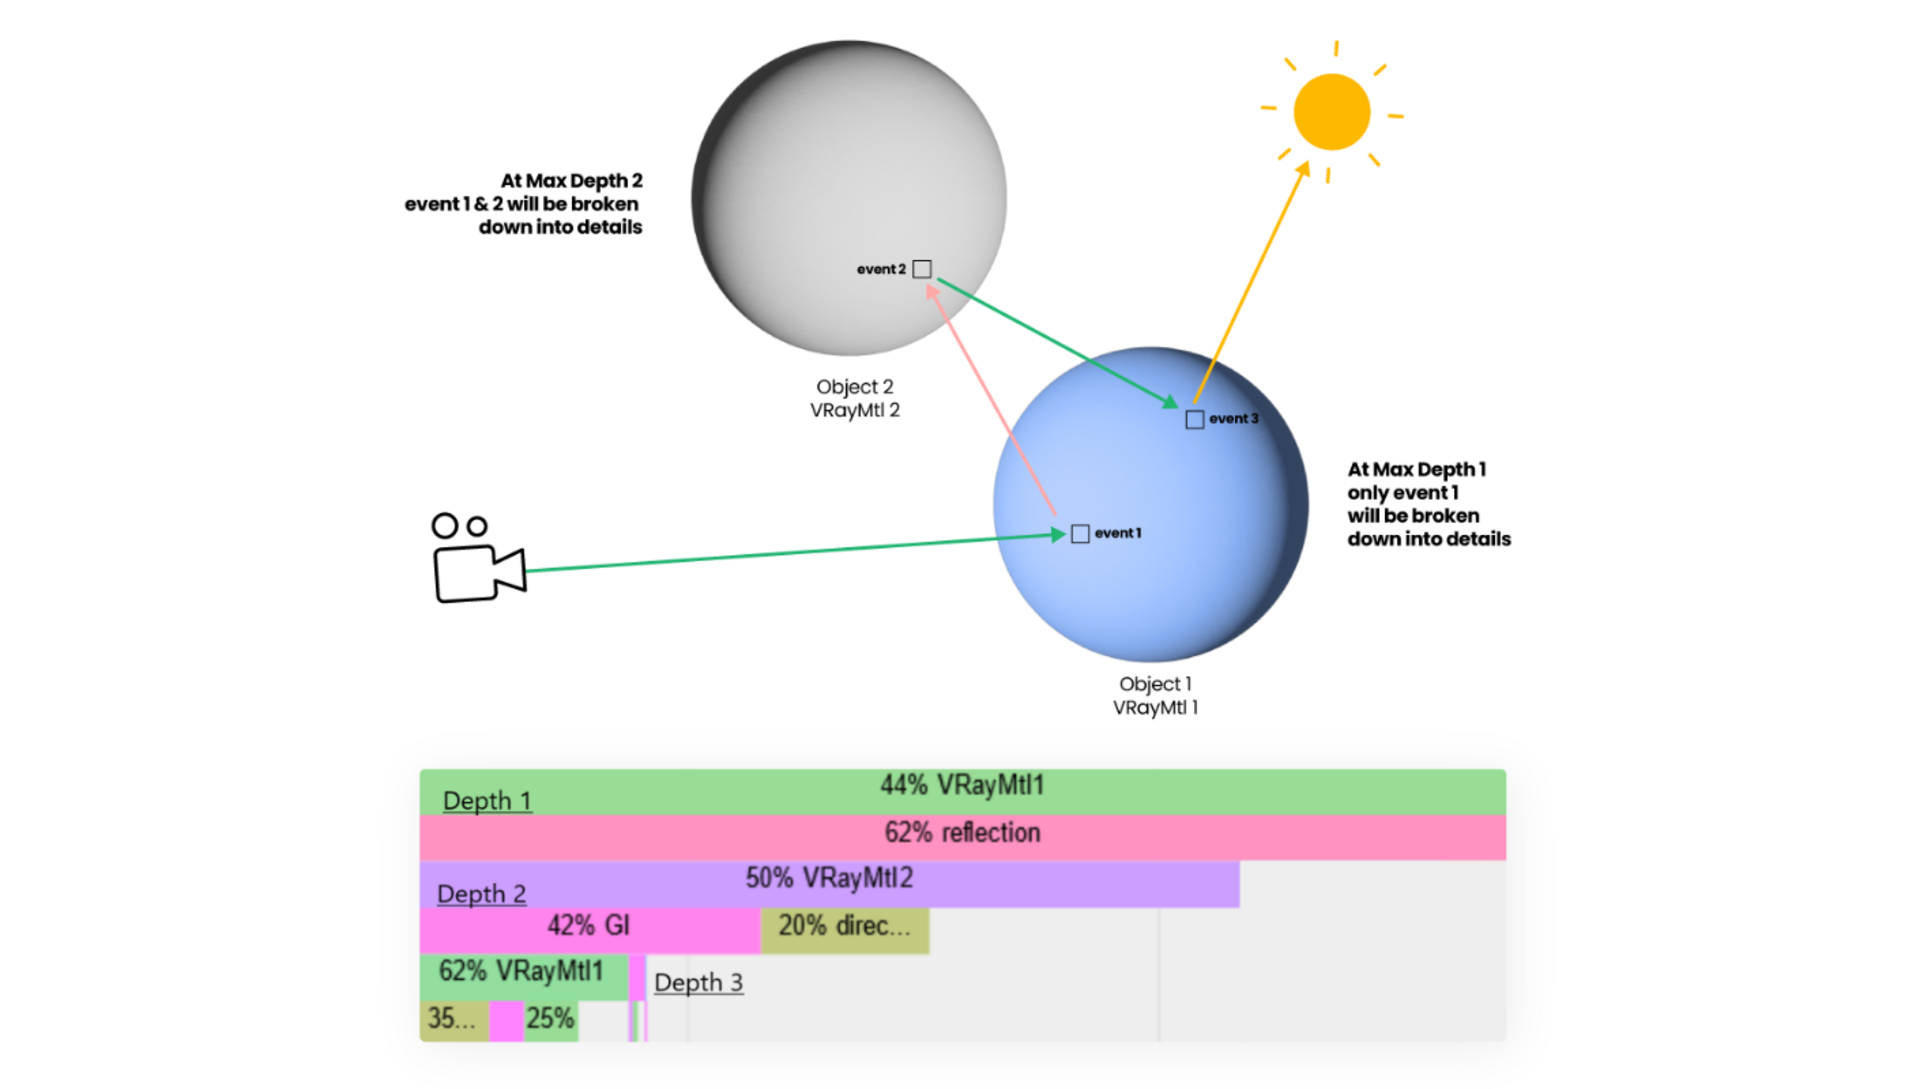
Let’s say our render camera sees an object (we’ll call it object1) with VRayMtl1 that reflects another reflective object (object2) with VRayMtl2. Our first camera ray hits object1 and spawns another ray towards object2. At this point, we’ll write down that VRayMtl2 contributes to VRayMtl1’s reflective component and also start tracking the second ray that bounces off of VRayMtl2. Both of the time measurements will continue until the ray has terminated its path. This will occur many times for all the different components of each material. The larger the value for Max Depth, the more measurements the Profiler takes, and the bigger the performance hit. For most tests without many reflections or refractions, we recommend sticking to the defaults and using All mode with a Max Depth of 1
On the other hand, the System mode reports basic data we collect during the rendering process anyway, so enabling it won’t give you any performance drawbacks.
The hitchhiker’s guide to profiler reports for rendering optimization
Okay, so we know what the V-Ray Profiler is. We know how it works, but how can we read it? Let’s start with the Rendering report and cover some shading basics first.
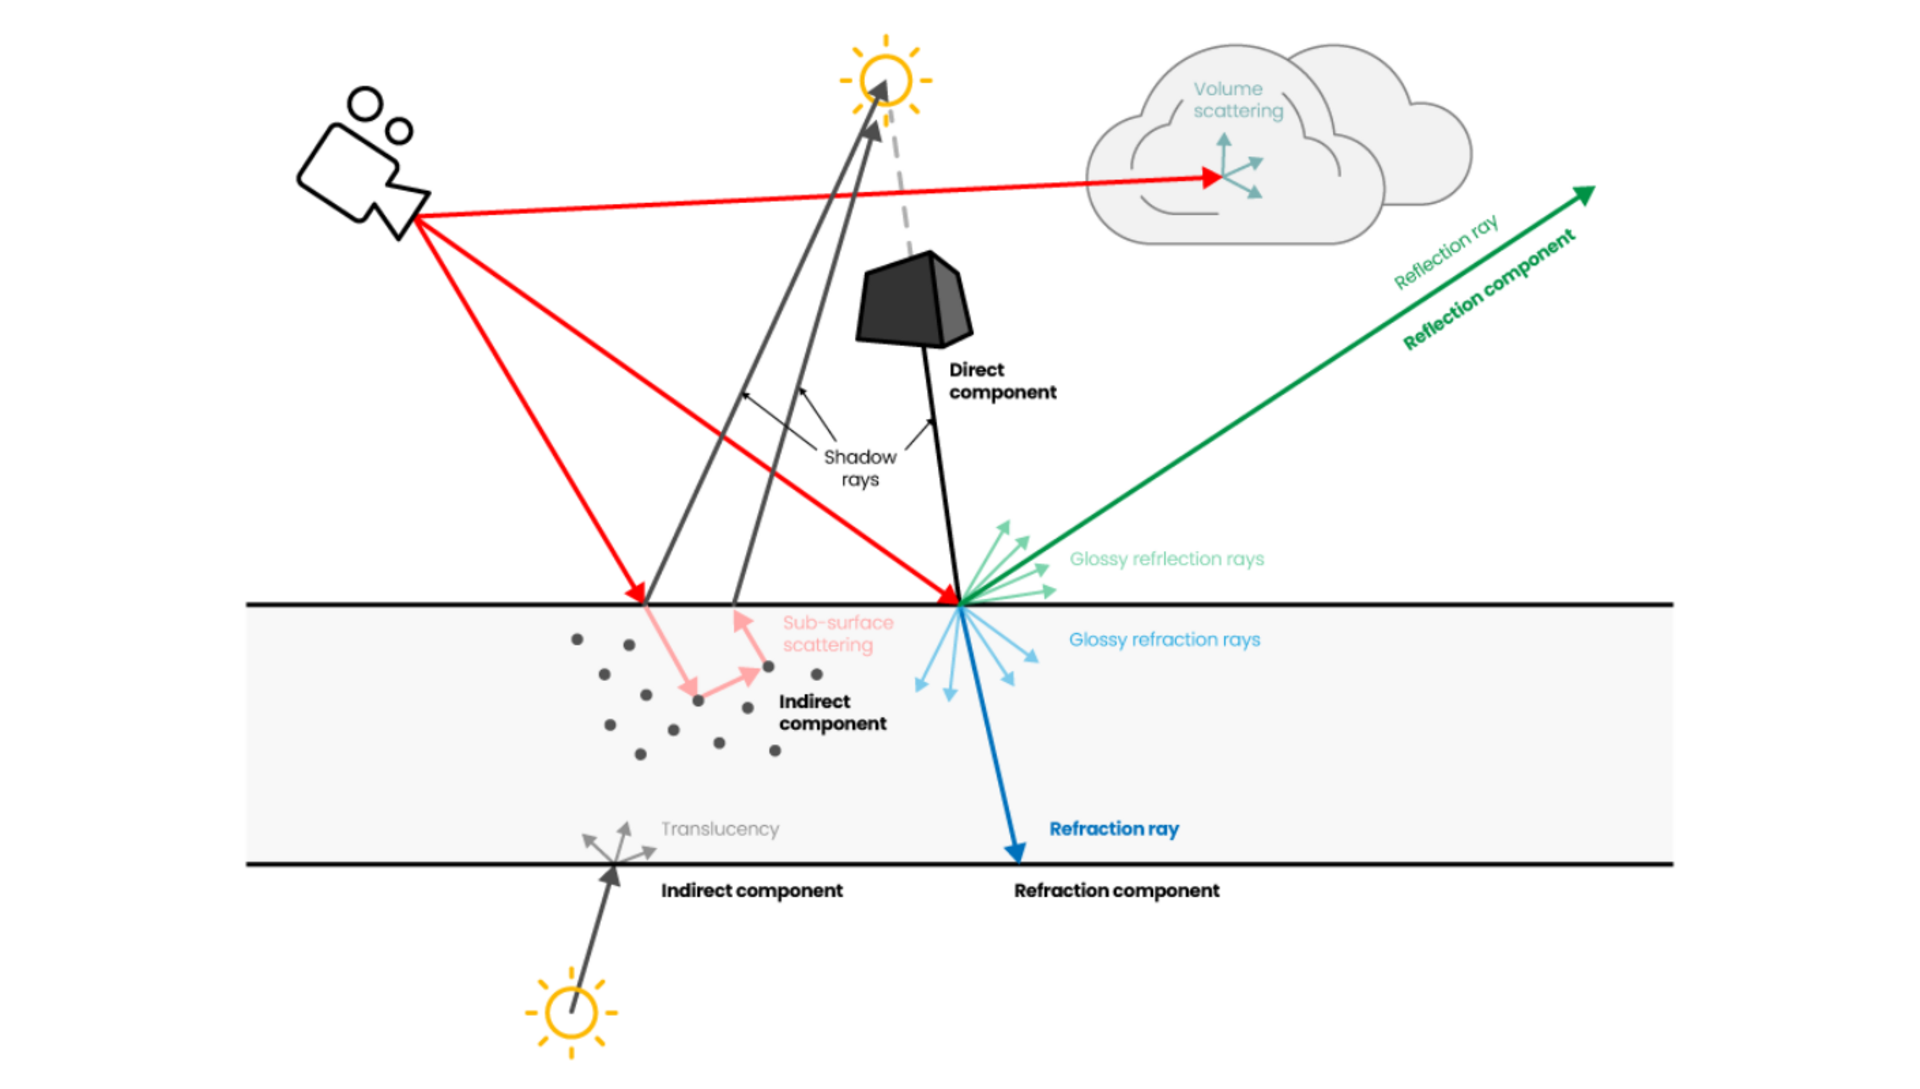
In simple terms, when rendering an image, rays are cast from a virtual camera through an image plane onto different virtual objects with their own specific shading properties. When the rays hit an object, based on its properties, different types of secondary rays are spawned forward. Shadow rays are traced to the light sources to determine direct illumination and shadows — this is visible in the direct light component. If the material has reflective properties, reflection rays are cast, which is visible in the reflection component. On the same principle, we have refraction rays responsible for the refraction component; subsurface scattering rays are in the indirect components, and so on.
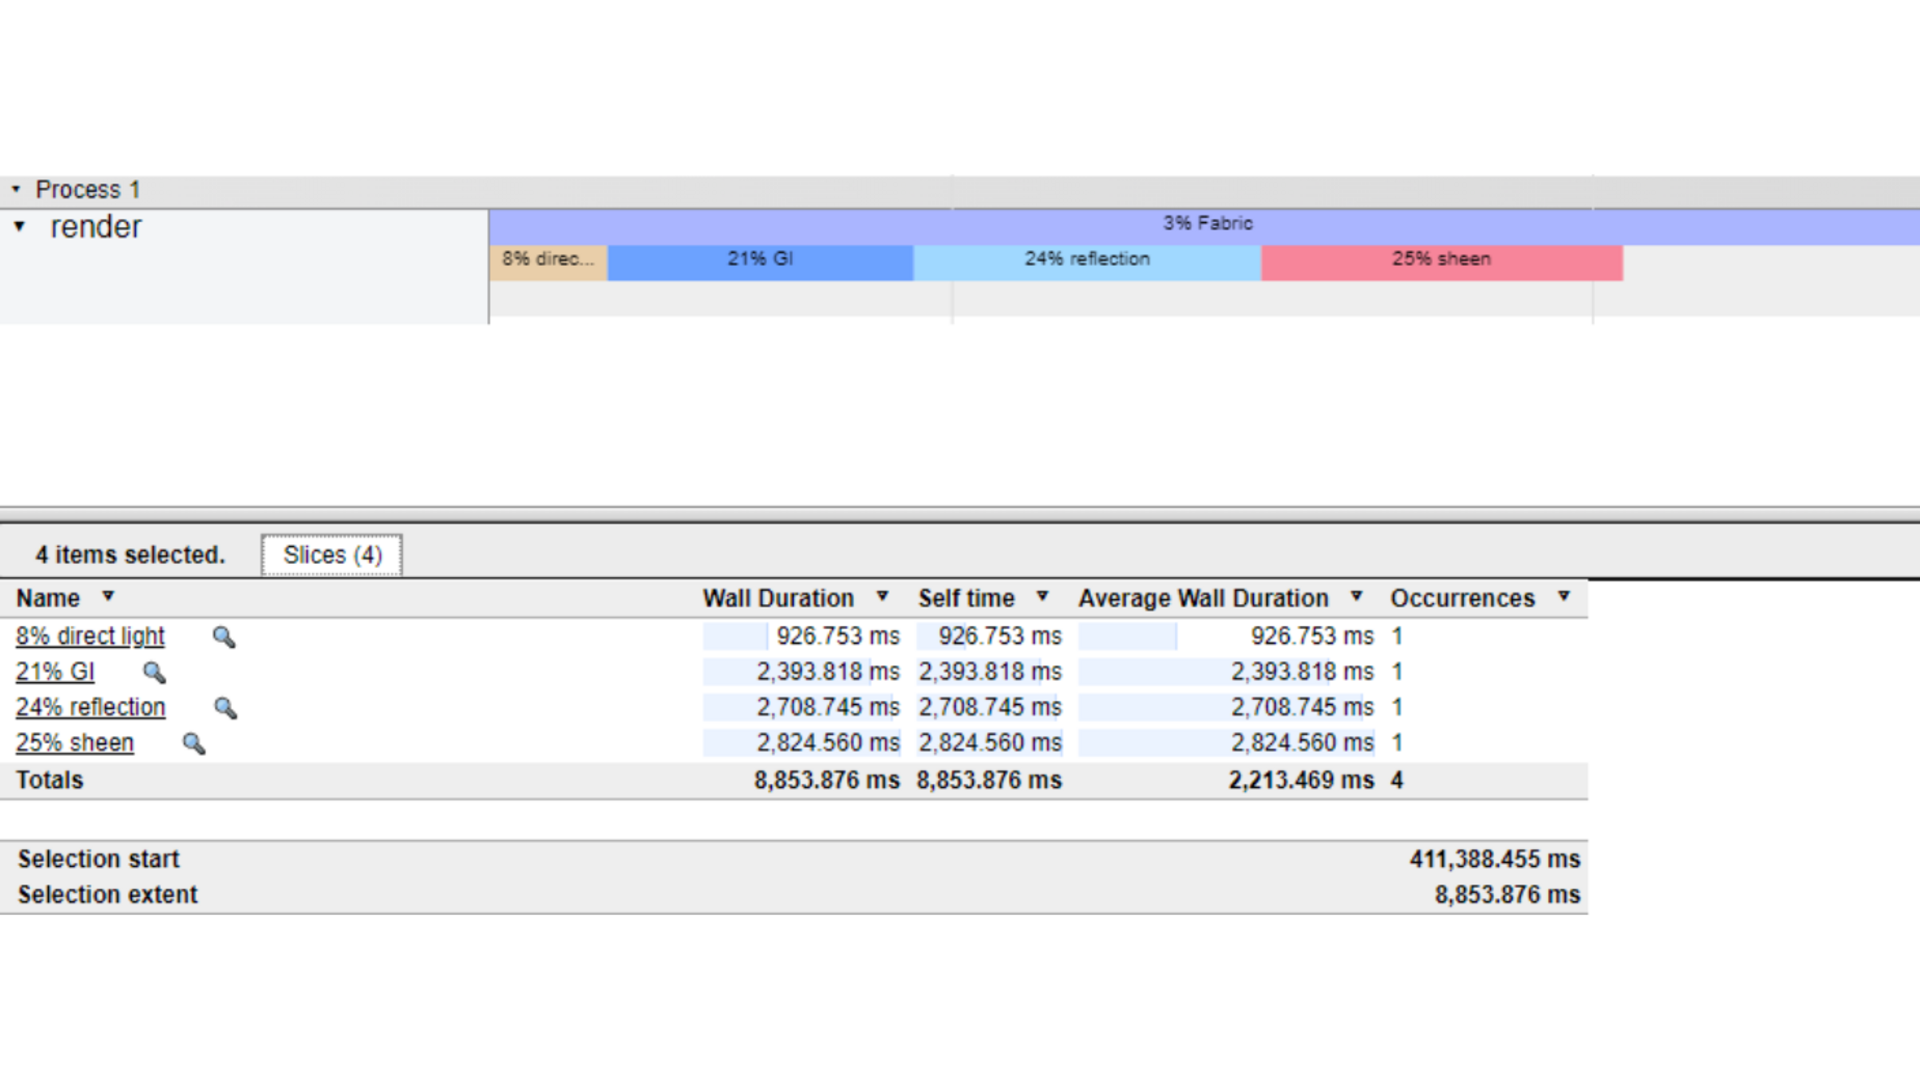
A summary of the recorded time measurements per component will be used for the final result alongside the relative time for each given material. It will be represented as a percentage of the total time spent in shading. You may notice that all your materials’ percentages add up to 100 in the report, but in contrast, the components don’t. The reason is we don’t trace all events that occur during shading, as the user has practically no control over them.
In the reports, you can look for some of the materials that take the biggest chunks of time and observe which of their components causes them. Based on that, you can adjust different attributes of the materials and compare approaches to what works best. For example, you can compare materials with different SSS settings or a lot of roughness in their reflection and a similar, glossier result.
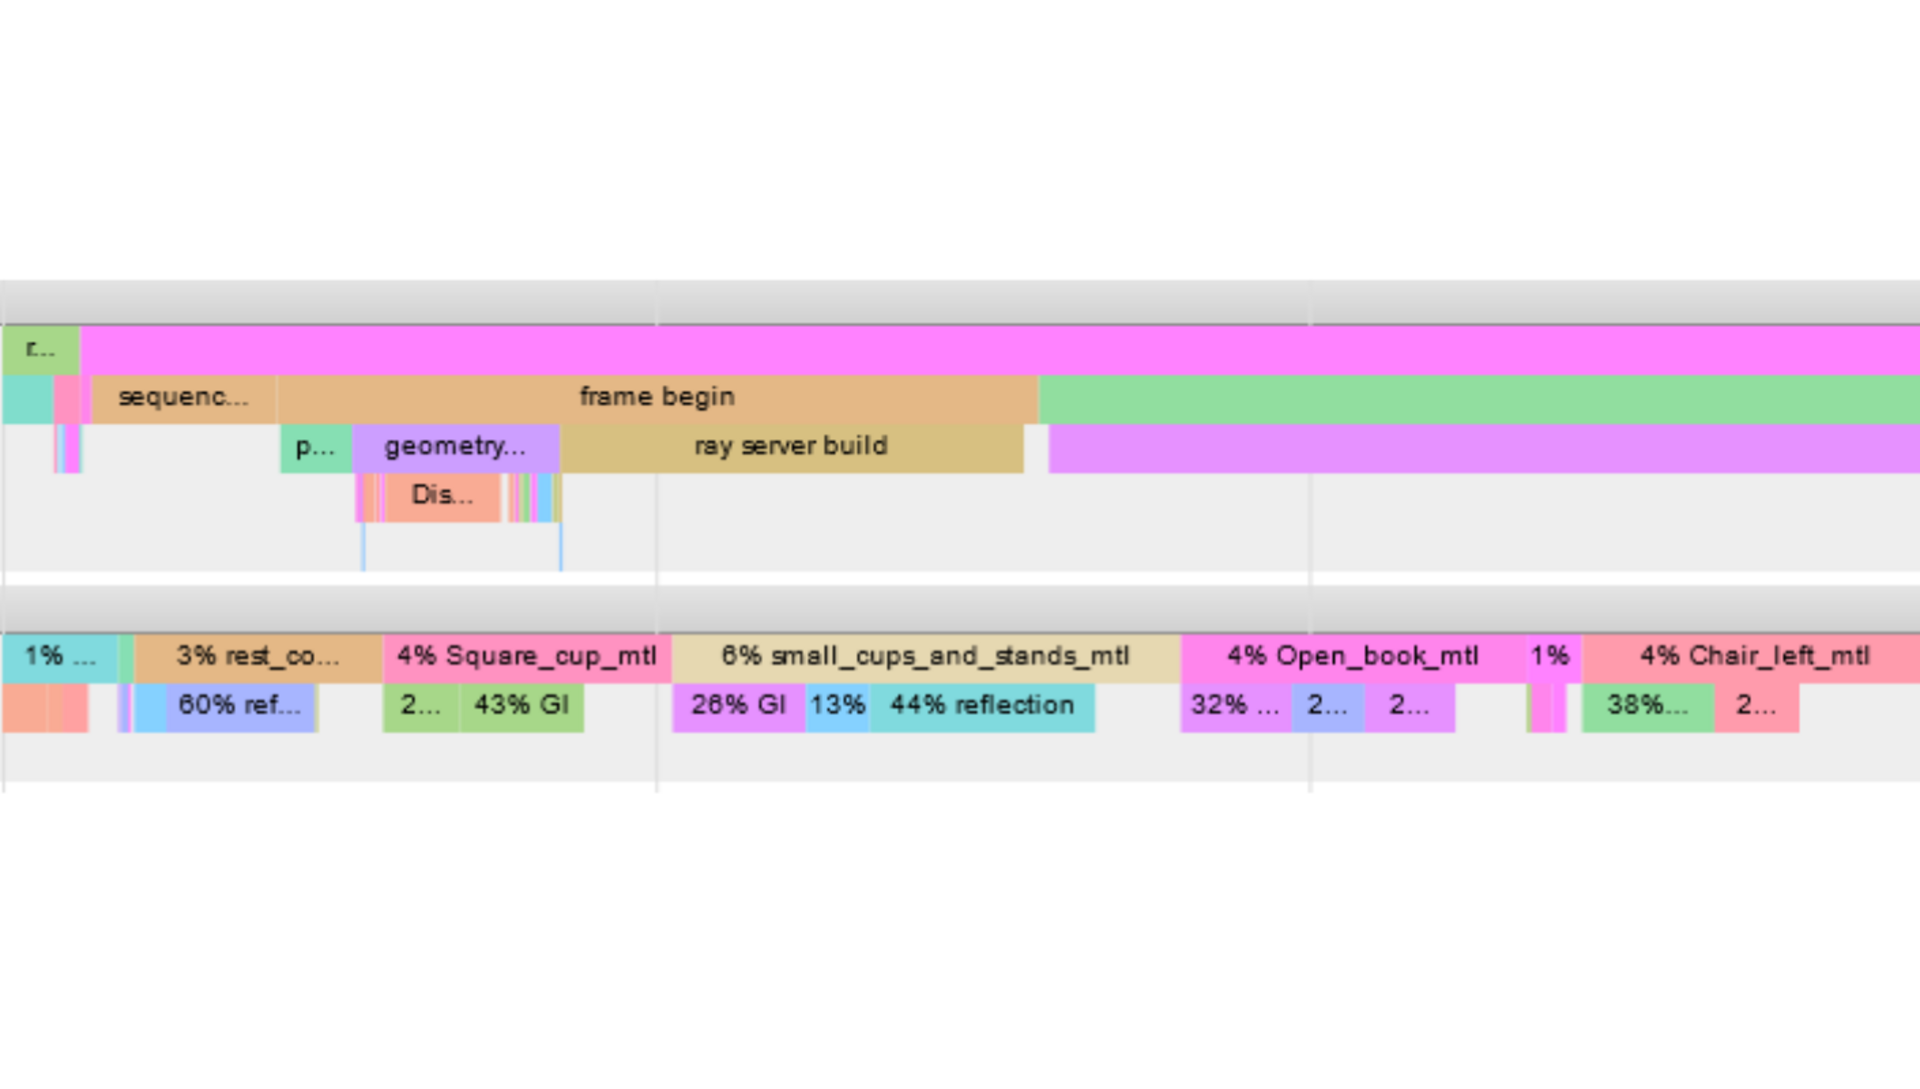
The System mode collects information for pre and post-rendering processes. The events listed would depend on what is present in your scene and your render settings, but there are some that will appear in almost all cases, such as render and license initialization, export, python post translation, keyframes creation, sequence begin, frame begin and render, Settings, lights, V-Ray Toon, environment settings, render elements, geometry and materials, light links, plugin initialization, geometry compilation, ray server build, light cache build.
Unusually high render times in any of these components would be a reason for double-checking if the scene’s setup can be optimized. An example of this would be geometry compilation and its further breaking down per mesh node. In it, you can look for meshes that can be further optimized from their subdivision and displacement settings.
This video tutorial on using the V-Ray Profiler is a good example of examining reports and applying relevant changes.


Benefits of using the V-Ray Profiler
Unfortunately, post-production can't fix everything, and rendering time is one of those things. With just one render in “All mode,” you can identify rendering hotspots such as slow materials and geometry. If you suspect an aspect of your scene that is outside of shading can be optimized, the system mode can assist at virtually no performance cost. Hone in on specific aspects of your scene and use a scientific approach to compare different setups.
Additionally, if you’re working on projects under NDA but would love for us to have a look, you can generate a profile and send it to us for further investigation.
Read more in the Documentation pages on V-Ray Profiler in Maya, Houdini, and Cinema4D.
Conclusion
In conclusion, the V-Ray Profiler serves as a valuable tool for users seeking to optimize their rendering process. It allows for a detailed analysis of the time spent on various components within scenes, aiding in diagnosing and comparing performance factors, including materials, geometry, subdivision, displacement, render settings, and different workflows. With the help of its two modes — System and All, users can gain deep insights into the rendering process, making it an indispensable tool for optimization and a valuable resource for artists at all levels.